The acquisition can be started activating the START button. During the acquisition, the Hide /Show Controls button  allows the selection of the channels curves to be displayed.
![]()
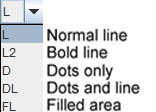
The list selection can be used to change the style of the curve in the display area:

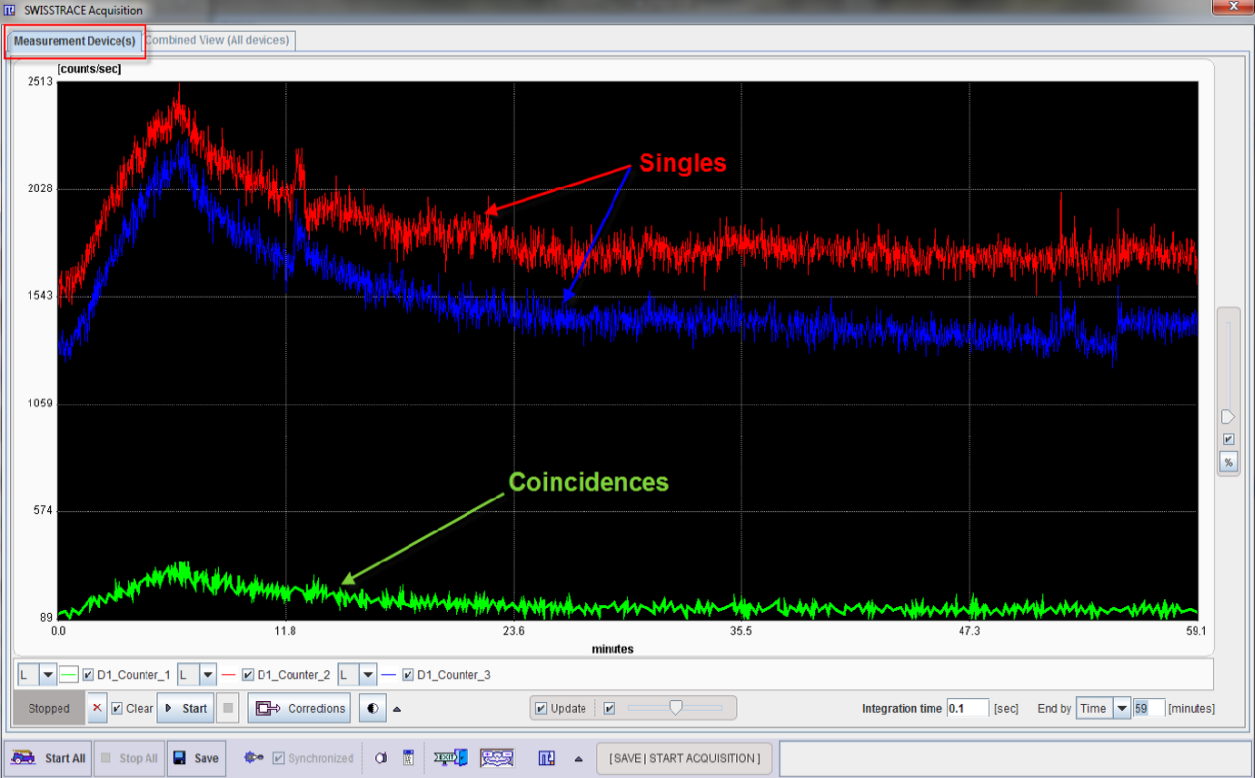
The result of a 60 minutes acquisition for one device with 3 active channels is shown below:

The acquisition can be started separately for each device with the START button. Alternatively, the acquisition can be started simultaneously for all devices activating the Start All  button. The duration of the experiment depends on the time protocol set up. Independently of the protocols, the acquisition can be stopped simultaneously for all configured devices selecting the Stop All
  button.
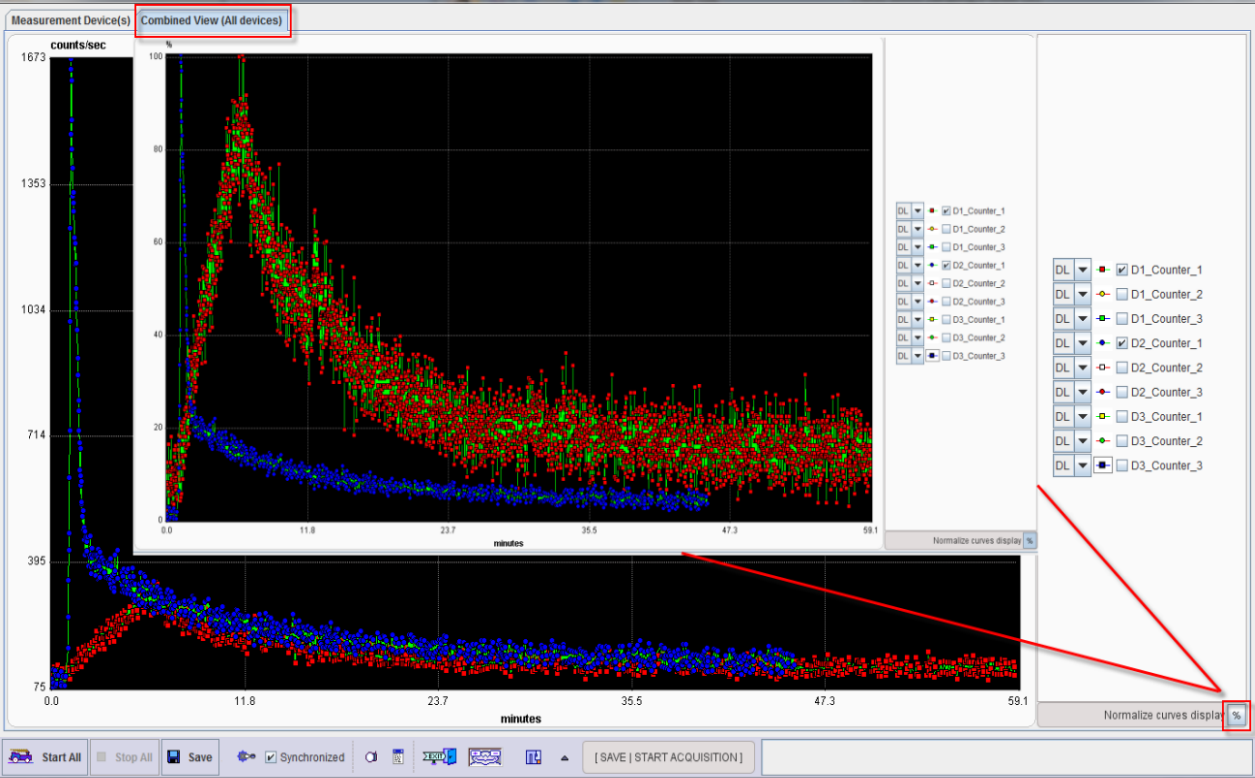
The results for a multiple devices multi-channel configuration can be easily inspected in the Combined View (All devices) tab. The curves of interest can be enabled for display and normalized to their own maximum and shown as percent values. This mode is helpful for comparing shapes when the dynamic range of the curves is very different. This display facility can be quickly achieved with the Normalize curve display button  , located laterally respect to the display area. In the example below, the inner graphic is the normalized representation of the original one.
