R console
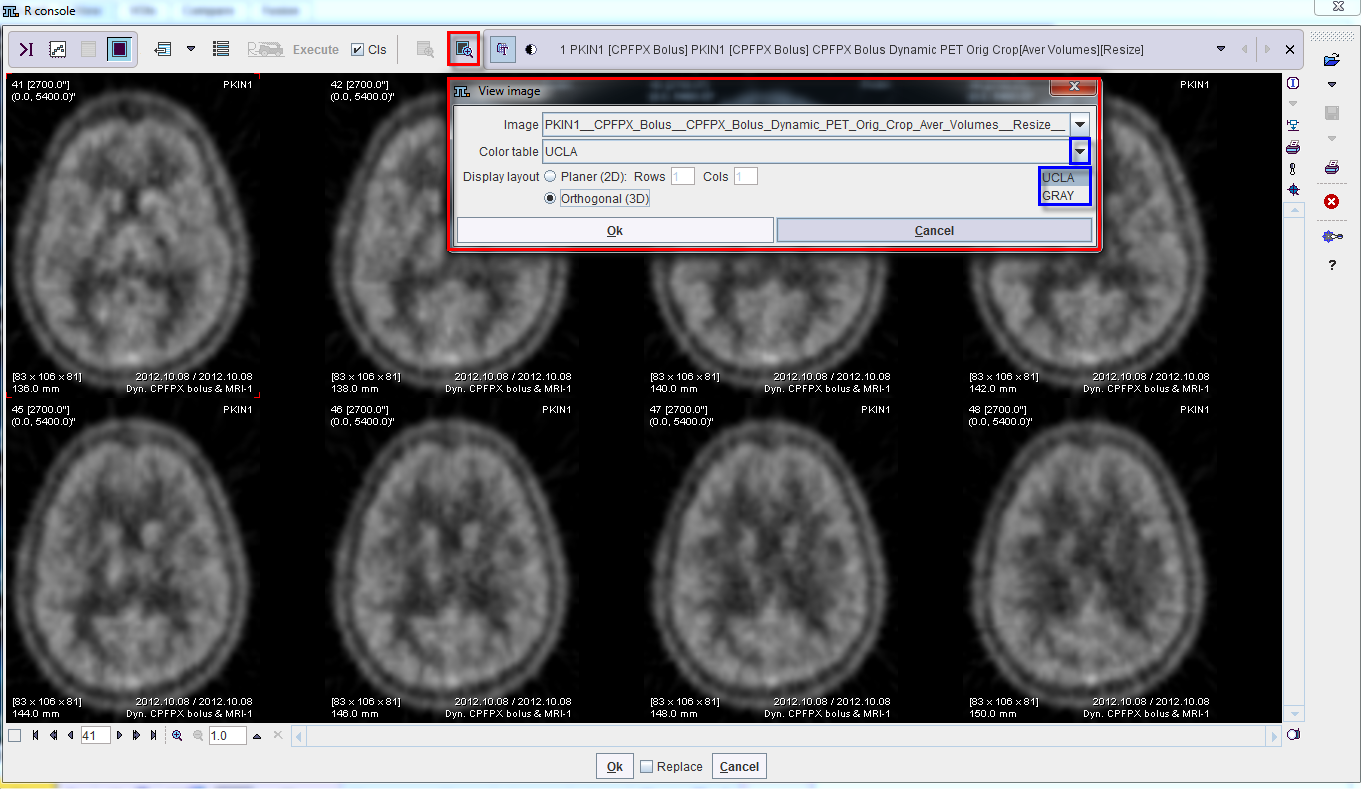
Allows loading the image data displayed in the view port in the PMOD R interface for further statistic analysis.

The image display layout in the R interface can be defined activating the Preview of image ...  icon available in the top line. A dialog window appears.
- The Color table allows switching between the Gray and UCLA options.
- The Display layout allows configuring the number of images shown concurrently: the Planer (2D) allows defining the number of Rows and columns Cols while the Orthogonal (3D) allows showing three orthogonal slice images. When orthogonal display is selected and confirmed, the intersection point can be moved by clicking into the images.

![]() icon available in the top line. A dialog window appears.
icon available in the top line. A dialog window appears.