![]()
![]()
![]()
![]()
|
|
|
|
|
The Descriptive statistics script serves for summarizing the statistical properties of outcomes assembled in one or several PMOD aggregates.
Preparation
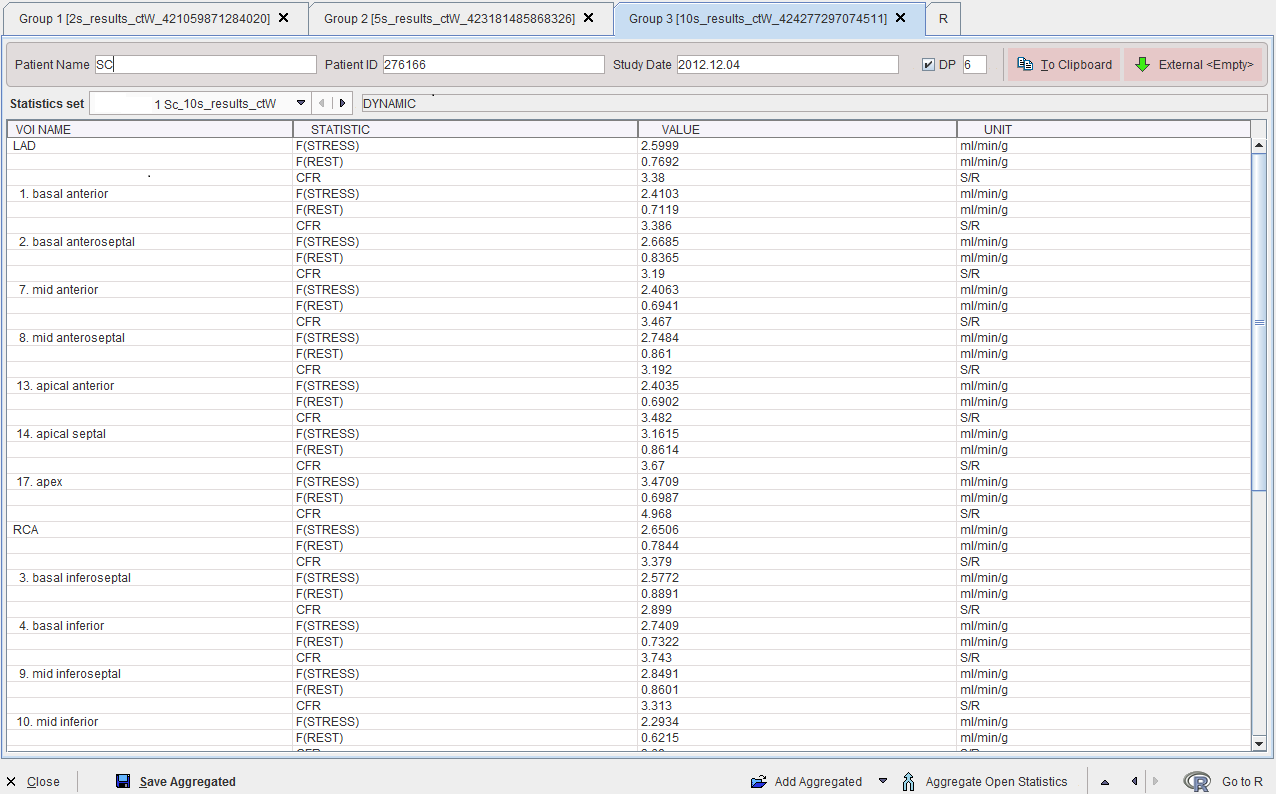
The example below uses three aggregates from the quantification of myocardial perfusion by PCARDP. The purpose of the study was to evaluate the impact of the initial frame rate on the perfusion estimate. Correspondingly, the aggregates represent 2 sec, 5 sec and 10 sec sampling. Each of the aggregates has 12 datasets (Statistics set) with 3 STATISTIC results, the stress flow F(STRESS), the rest flow F(REST), and the coronary flow reserve CFR in 17 VOIs (=cardiac sebments, LAD, ...). Illustrated below is the R console with the three aggregates loaded.
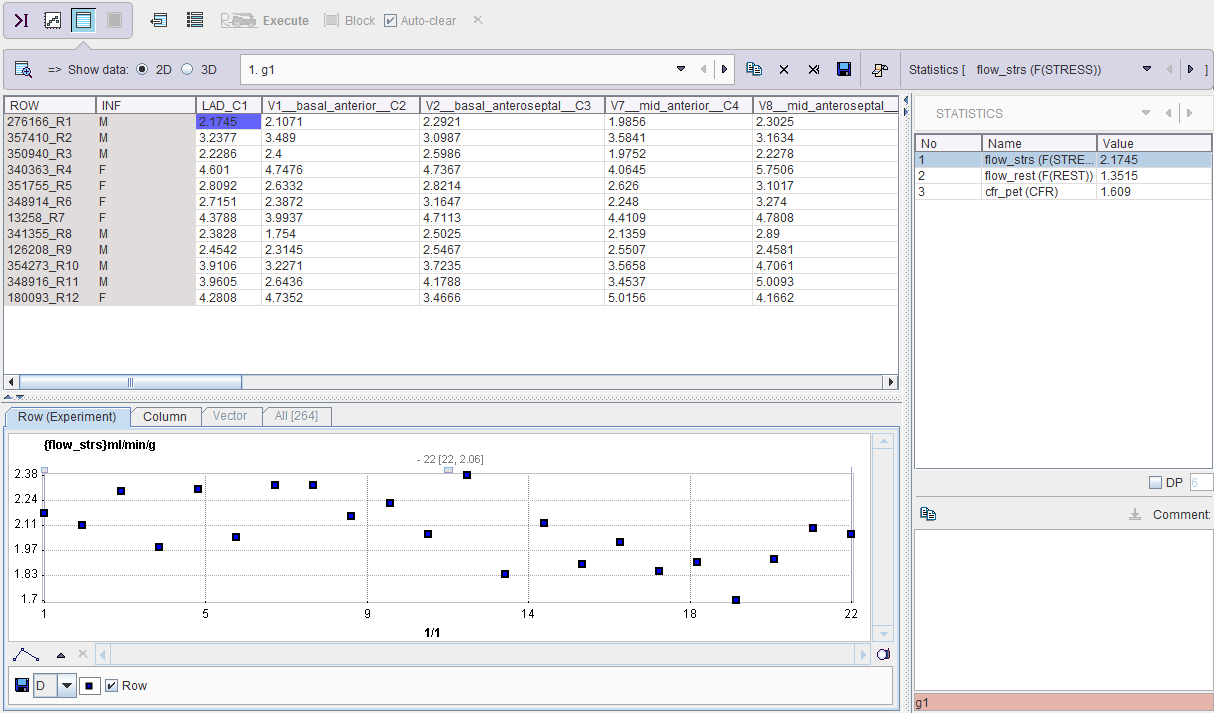
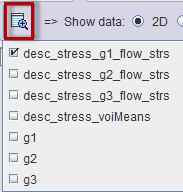
Transferring the data to R with Go to R creates the 3 workspace variables g1, g2 and g3. The table layout illustrated below shows the structure of g1 with the subjects in the rows, the VOIs in the columns, and the statistics as a selection.
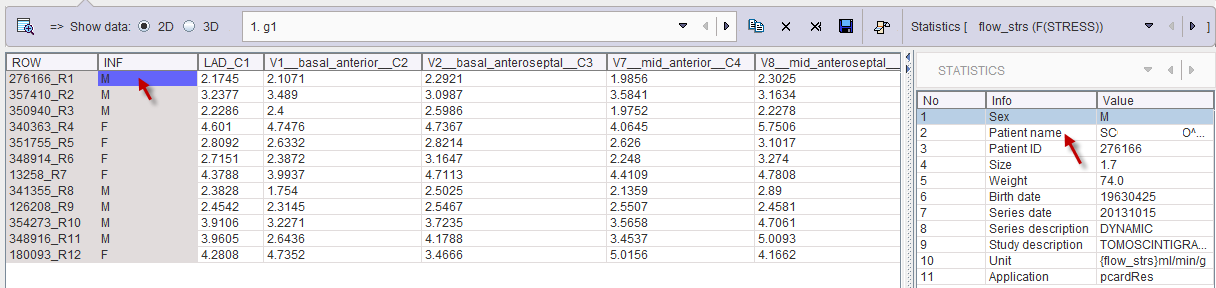
Note the INF column which can be used to show selected demographic data, the gender in the example above. To change to a different information item please double-click an element in the INF column. The STATISTICS list is switched to the demographic information, and the element of interest can be selected.
Descriptive Statistics Configuration
The Descriptive Statistics script shows the following dialog window.
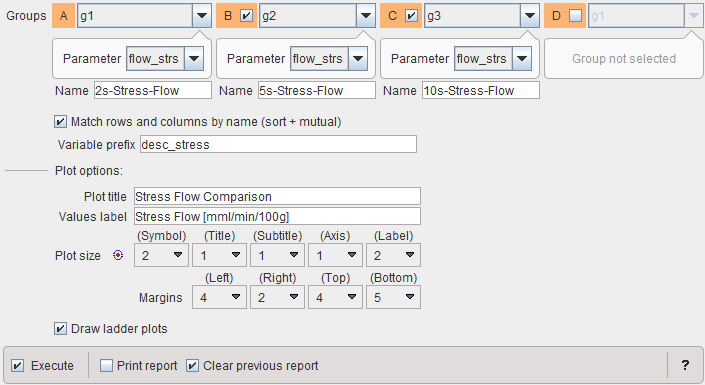
Note that up to 4 data sets can be compared. In the example case 3 Groups are selected and the variables g1, g2 and g3 assigned such that the sampling time is increasing. Only one statistic can be compared at a time, to be selected from the Parameter list. If the parameter names don't match, the program will complain, but still perform the calculation.
The results will include tables as well as graphic plots. To group the table results a Variable prefix can be specified. Plot title and Values label should be edited such that the plots are meaningfully annotated. The Draw ladder plot option allows visualizing each data point across the three data sets.
Descriptive Statistics Results
After running the script the workspace is populated with new variables, and plots have been generated and added to the plot history. The R console is in the table layout and shows a statistic summary table of the third group g3. For each VOI the desc_stess_g3_flow_strs table shows minimum, first quartile (Q1), median, mean, standard deviation. third Quartile (Q3) and maximum across the 12 subjects.
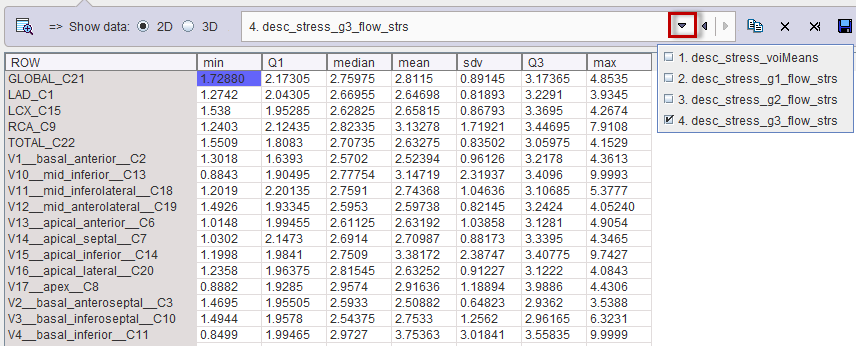
Using the history, the table can easily switched to the other groups, as well as the voiMeans table which just shows the VOI means and standard deviations. Note the copy and save buttons in the buffer controls for exporting the table data.
Note that the workspace now has 4 additional variables, with the defined prefix.
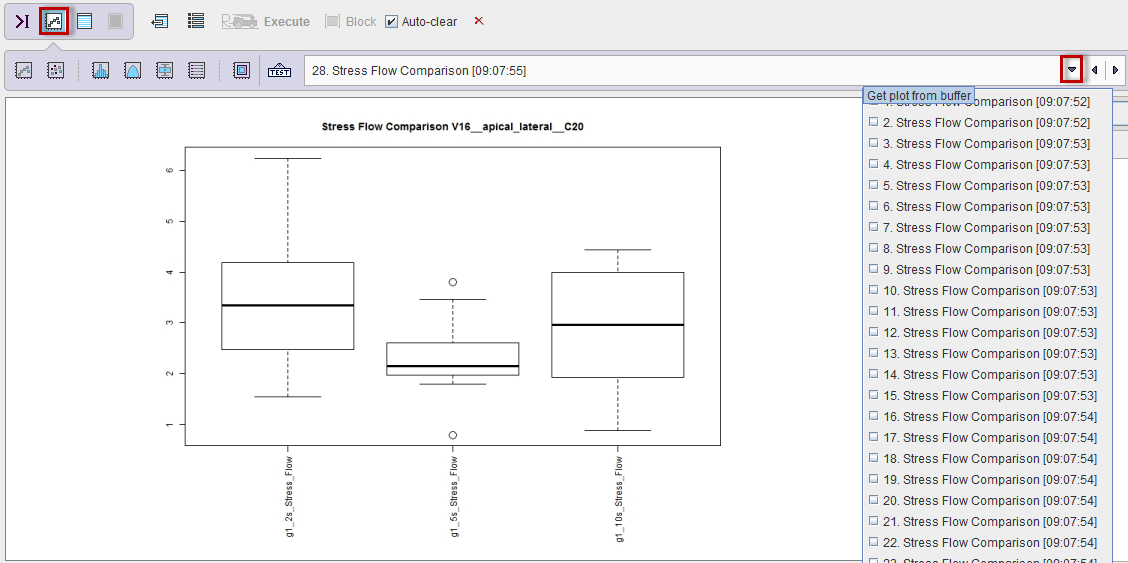
The same information as in the tables is visualized by one box plot per VOI, providing a convenient side by side comparison of the groups. Please activated the plot layout and use the buffer arrows to browse through the different VOIs.
If the Ladder plot option was enabled, box plots are alternated with ladder plots.