The Regular Display functionality in PFUS allows reviewing three matched studies in parallel. Furthermore, VOIs defined in the first row can be applied to the studies for generating 2D and 3D scatter plots. The Regular Display mode can be selected in the lower right
 ,
,
by selecting ![]() in the taskbar, or by the Scatter Plot 3D in the Menu. The latter two methods will also prompt for VOIs for scatter plots.
in the taskbar, or by the Scatter Plot 3D in the Menu. The latter two methods will also prompt for VOIs for scatter plots.
The study selection allows in each row to select among all loaded studies. When reviewing, the three studies shown will always be synchronized.
Scatter Plots
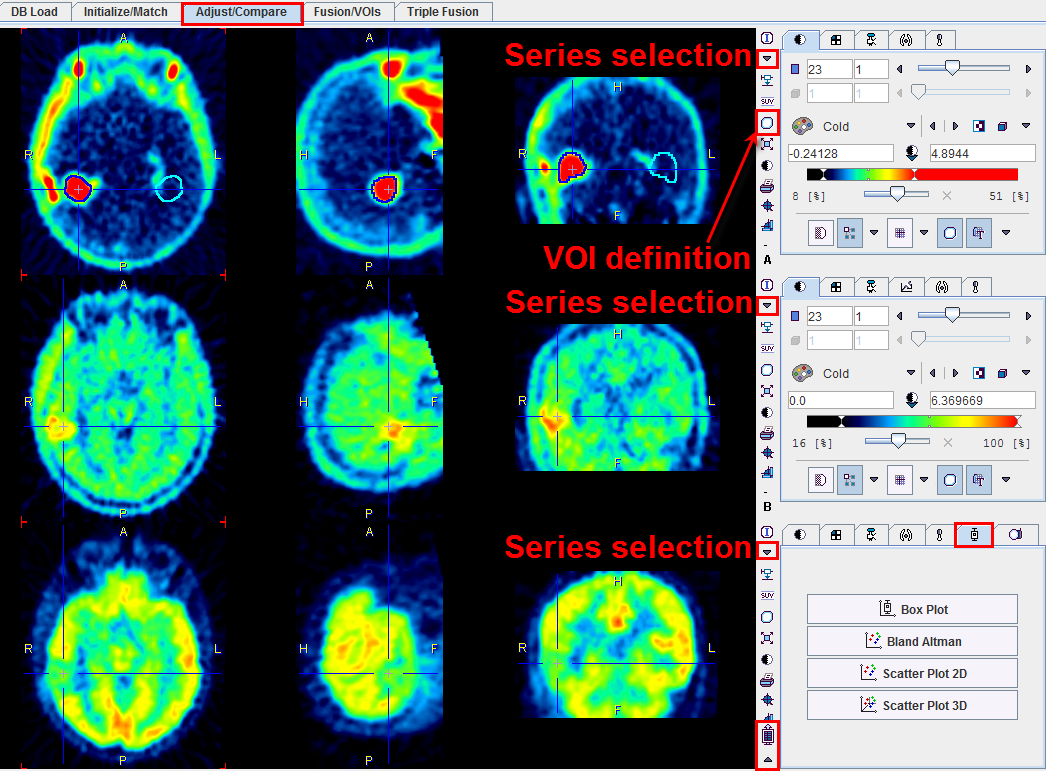
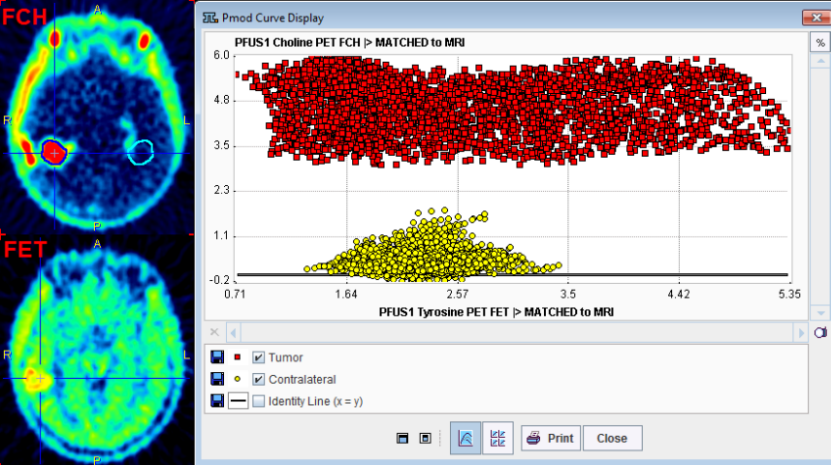
Scatter plots are a means to visualize the value of a pixel in different image series. The VOI(s) must be defined in the uppermost image row. There, the VOI tool can be started as indicated and an arbitrary number of VOIs can be outlined. Using the buttons in the lower right scatter plot generation can be started. With Scatter Plot 2D the pixel values are evaluated in all the VOIs of the upper two rows and shown in a scatter plot.
If the P3D option has been purchased, there is also a Scatter Plot 3D button available. When it is selected, the VOIs in the studies of all three rows are evaluated, and a 3D scatter plot generated, for example
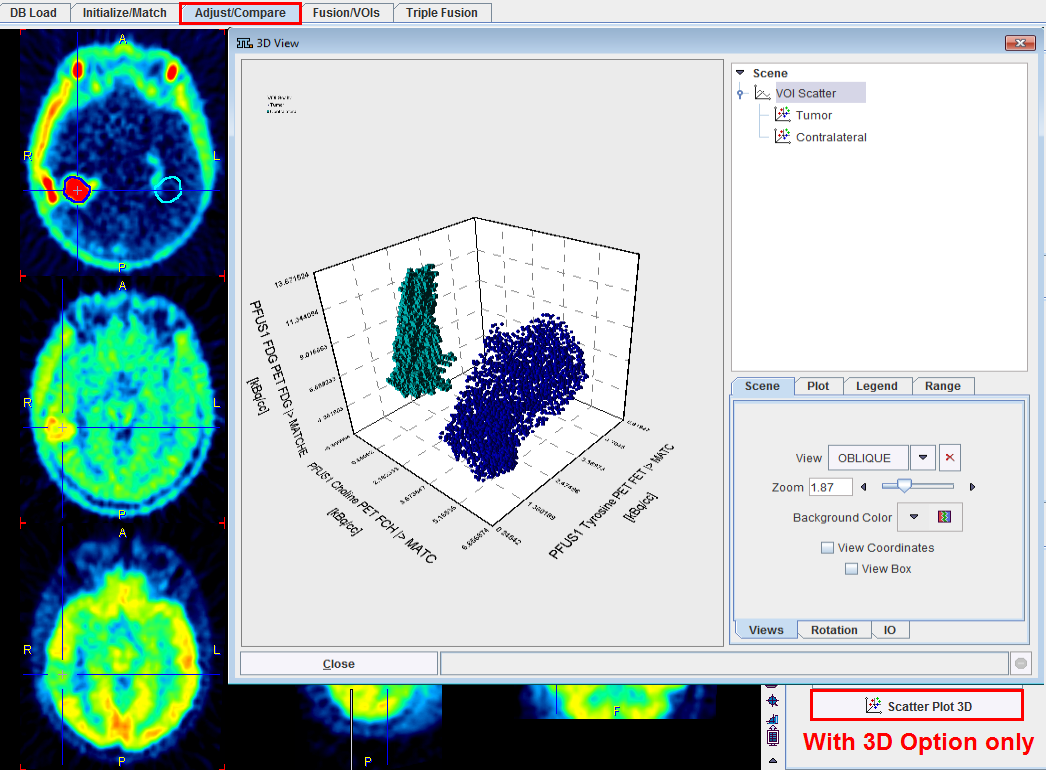
Note: In P3D, the numeric scatter data can be saved as a text file using the Save button on the IO sub-panel.
Box Plot
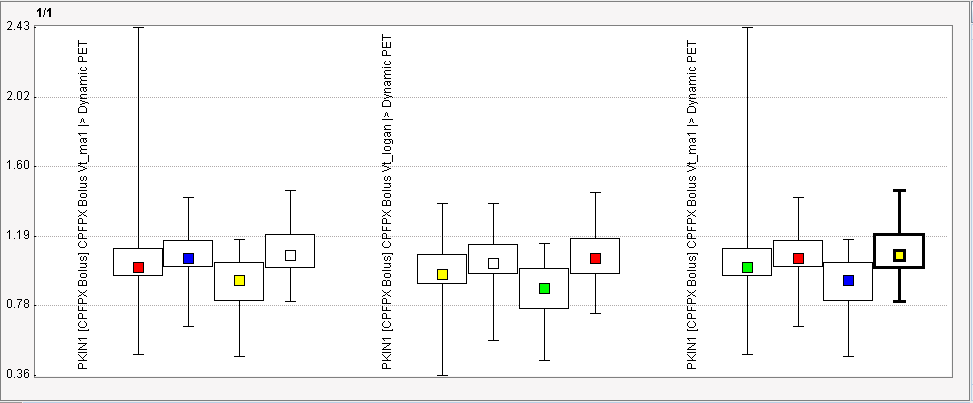
The Box Plot calculates a box plot representation of the VOI pixel values for all three image sets.
Bland Altman Plot
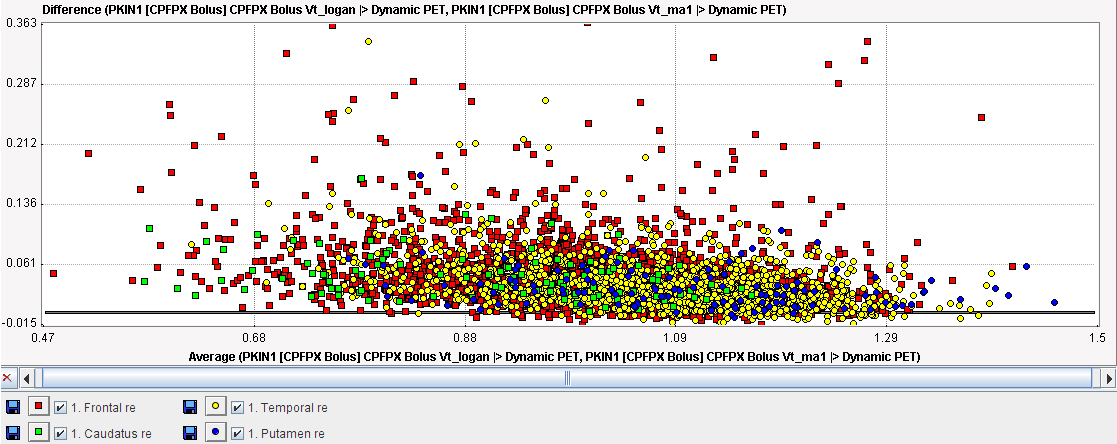
The Bland Altman plot can be used for a quick method comparison. For each VOI pixel it calculates the average and the difference across the images in the upper two rows, and plots the result (average on horizontal axis, difference on vertical axis).
