For many of the supported models some type of preprocessing or the specification of some information piece is required before the actual pixel-wise calculation can be started. Preprocessing operations may require certain input information, typically:
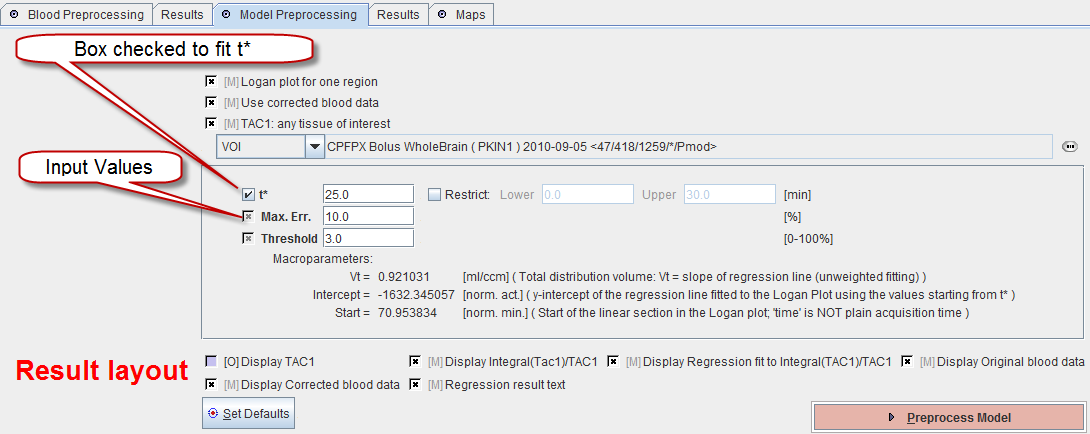
In the Model Preprocessing panel, the preprocessing parameters of the current model are listed. Typically, there are input parameters which will also be used in the pixel-wise calculation, as well as parameters of interest calculated during preprocessing. These are shown in the Macroparameters section. The parameters of each model are described in a separate section of this document. Note the Set Defaults button which restores the configuration typically used with the model.
Logan Plot Example
In the case of the Logan plot shown below the equilibration time t* must be defined from which on the plot is considered linear and a regression line is fitted. To determine t* the user must provide a tissue time-activity curve (TAC1) to which the Logan plot will be applied and shown on the Result pane. A fit or visual inspection allows specifying t*.

The first mandatory box Logan plot for one region indicates that the Logan plot must be performed with representative time-activity data. It uses the corrected blood curve resulting from the blood preprocessing step (mandatory Use corrected blood data box). The information used as TAC1 must be specified. This can be done by referencing a previously defined VOI as in the example above (VOI selection), by referencing a TAC data file with the FILE selection, the TAC (DB) selection, or a THRESHOLD selection.
The check besides t* indicates that this parameter will be fitted during preprocessing using the error criterion specified in Max. Err. The Threshold is a common input parameter in preprocessing which serves for background masking. All pixels with energy below the specified percentage of the maximal energy will be masked to zero.
Below the parameters is a section related to the information seen on the Result panel of preprocessing. Again, some elements are Mandatory, while others are Optional. For example, to inspect the TAC used in the Logan plot the Display TAC1 box can be checked. Note, however, that the axis scales differ between the TAC and the Logan plot in the Result curve plot.
How To Continue
If all required information for the selected model has been specified, start the model preprocessing step with the Preprocess Model button.
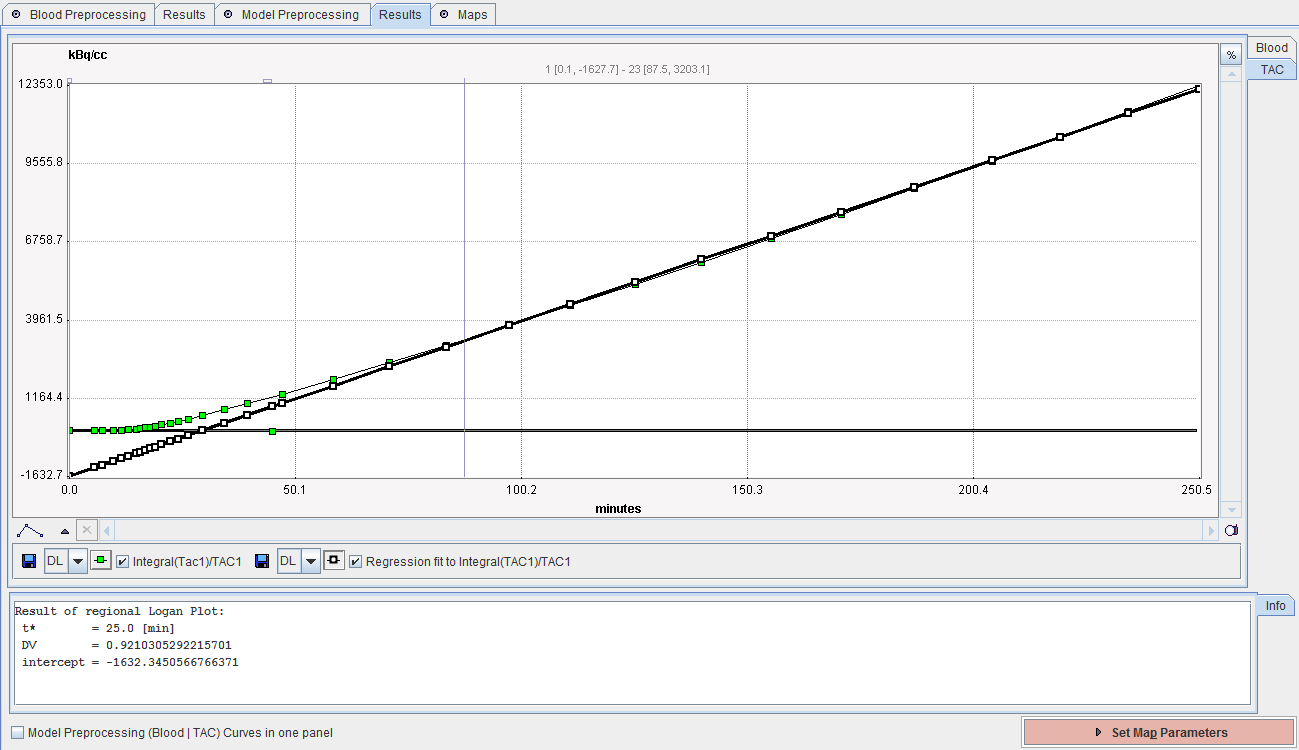
The Results tab shows the outcome of the model preprocessing. Again, the information shown is highly model-dependent, and in some cases will be entirely empty. The example below shows the result of fitting t* for the Logan plot with an error criterion of 10%. The Logan plot with the regression line is shown in the TAC curve panel, whereas the numeric output can be found in the Info area. The Blood data can also be inspected using the corresponding tab.

How To Continue
The purpose of this tab is to provide information for the user to decide whether the preprocessing was successfully. If this is the not the case, please select the Model Preprocessing tab and adjust the configuration. Otherwise proceed to the configuration of the desired parametric maps with the Set Map Parameters button.