![]()
![]()
![]()
![]()
|
|
|
|
|
The PMOD R Table window allows the inspection of the data frames available in the workspace. To preview a data frame from the workspace activate the Preview icon ![]() in the tool bar and select one of the variables (e.g. g1_avr). The program automatically switches to the R Table window
in the tool bar and select one of the variables (e.g. g1_avr). The program automatically switches to the R Table window  :
:
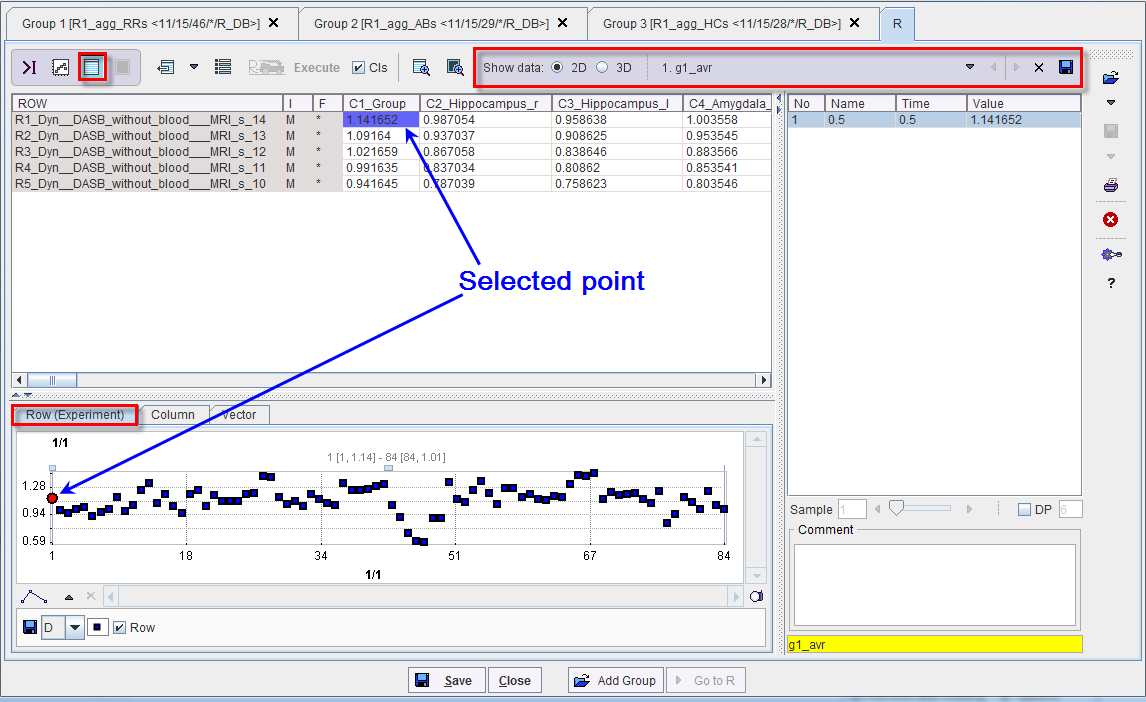
The Show data is set by default to the 2D visualization. The variable is previewed as a table in the upper left pane and as a plot in the lower left pane. The right pane is displaying the selected data into the table. The ROW data represents the statistics information available for one subject. The data are visualized as plot on the Row (Experiment) tab. The column data represents the average statistic information of one VOI for each subject from the group. The graphic visualization of the column data is available for inspection in the Column tab. The content of the right pane is plotted in the Vector tab.
The selected point can be changed by double clicking in the table pane. The plot tabs are updated accordingly. The value selected in the table is highlighted in blue. The corresponding value in the plots is shown as a red dot.
When the 3D radio button is enabled, the data is displayed in a 3D manner as shown below. This facility is mainly aimed for three dimensional data frame.
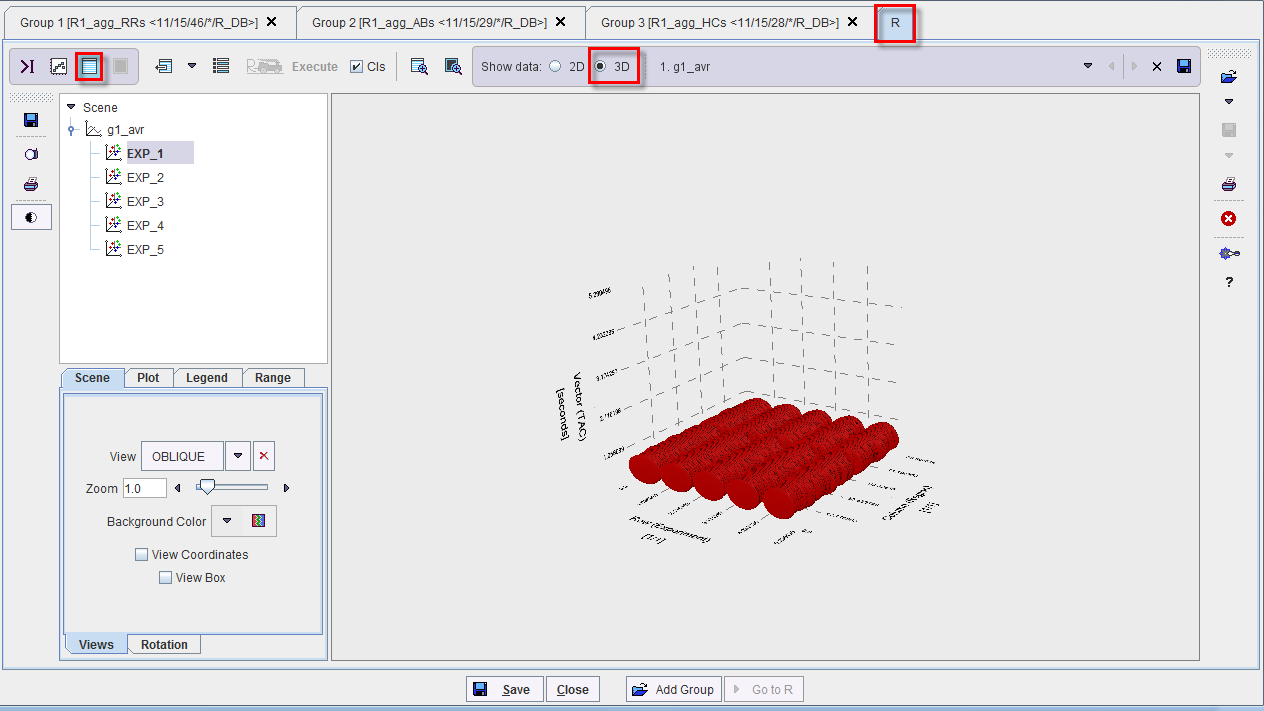
For further information about the 3D display please refer to the P3D documentation.
The Save icon in the Characteristic toolbar allows saving the table to a file. The X icon in the Characteristic toolbar allows removing table visualization from the history.