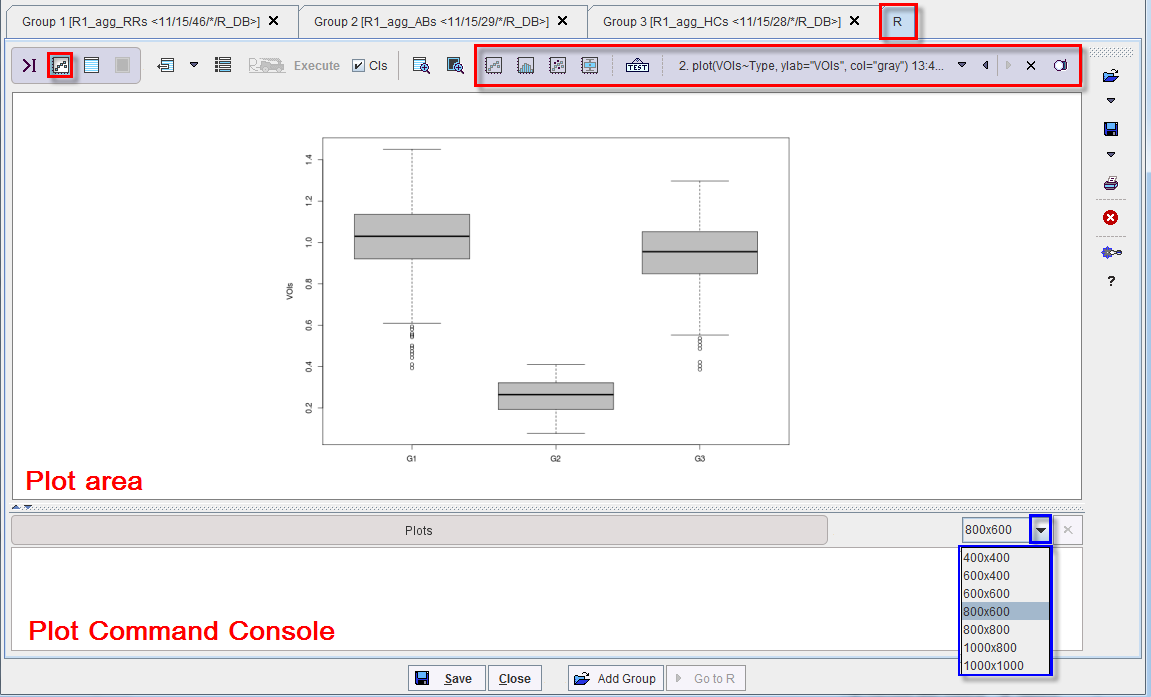
The PMOD R Plot window is accessible activating the dedicated icon ![]() in the main toolbar. The window is organized in two main areas as shown below: the plot area and the plot command window.
in the main toolbar. The window is organized in two main areas as shown below: the plot area and the plot command window.

The Plot window toolbar encloses the following functionalities:
|
Allows creating a plot command. Its activation opens a dialog window allowing various settings as shown below:
Note that when the OK button is activated the plot command automatically appears in the plot command console. To execute the instruction activate the execute |
|
Allows creating a histogram command. When the button is activated the hist() command automatically appears in the console. Please make sure that you select a numeric variable available in the workspace. Finally, activate the execute |
|
Allows creating scatter plots. When the icon is activated a dialog window opens allowing further settings as shown below:
Note that when the OK button is activated the plot command automatically appears in the plot command console. To execute the instruction activate the execute |
|
Allows creating boxplot of the data frame. When the icon is activated a dialog window opens allowing further settings:
Note that when the OK button is activated the plot command automatically appears in the plot command console. To execute the instruction activate the execute |
|
Allows testing the window while displaying a dragon fly example, as showm below:
|
|
Allows removing a plot from buffer |
|
Allows saving a plot capture with the defined resolution. When the icon is activated a dialog window appears allowing further settings:
Confirm the setting by activating the Save button. |