VOIs used for Statistics
The statistics of the image values within the defined VOIs can be calculated with the Statistics multi-function button.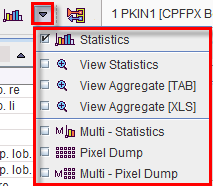
The following VOIs are considered in the statistics:
Statistics Numbers
Statistics calculates simple statistical information for all the VOIs and presents them in a dialog window. Note the radio box which allows switching between kBq/cc and the SUV, if all required information is available. If needed, the SUV-related information can be inspected and edited with the SUV button.
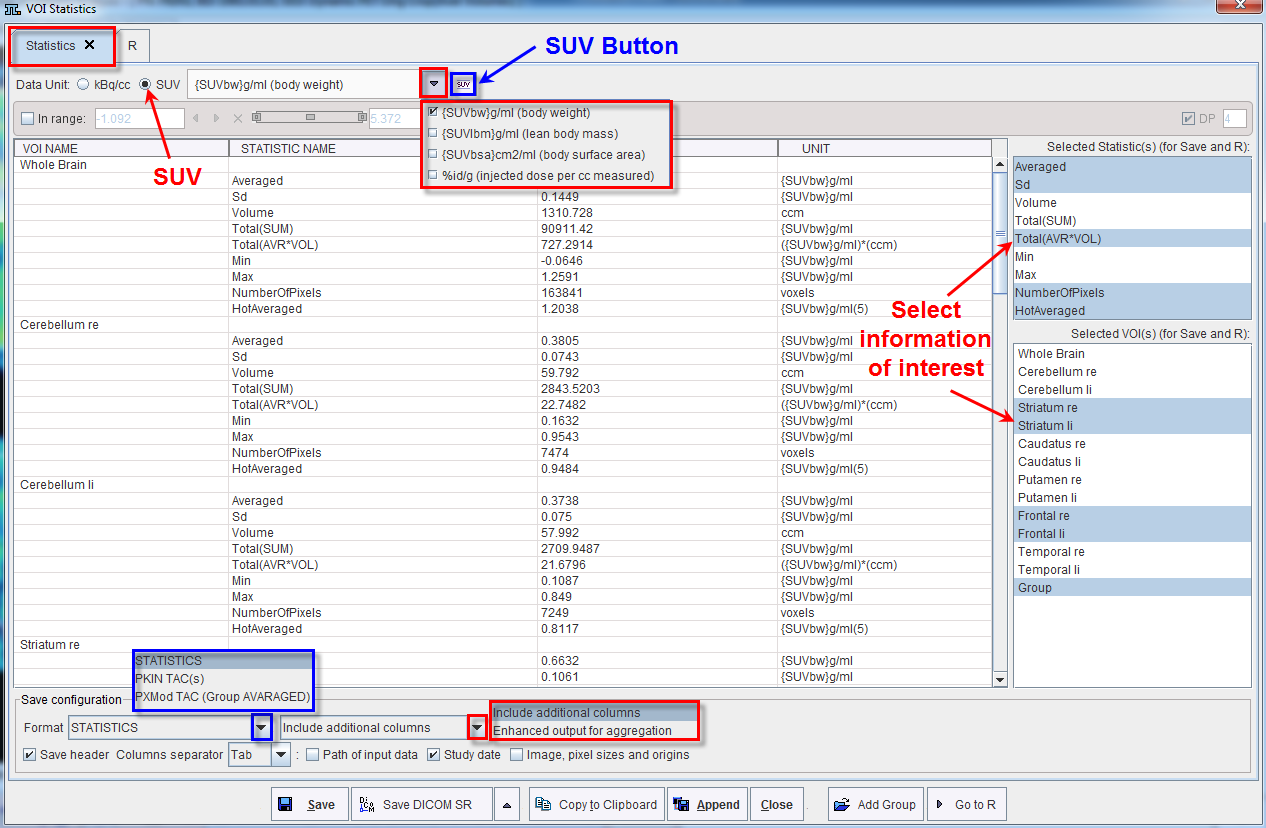
For each VOI the following pixel statistics is calculated.
AVERAGED |
Average of all VOI pixel values. |
SD |
Standard deviation of all VOI pixel values. |
VOLUME |
Volume of all VOI pixel values. |
TOTAL(SUM) |
Sum of all VOI pixel values. The interpretation depends on the image contents. In the case of activity units the result will be total activity in the VOI. |
TOTAL(AVR*VOL) |
Average of all VOI pixel values multiplied by their volume. The interpretation depends on the image contents. In the case of activity concentration units, the result represents total activity in the VOI. In the case of SUV units, the result is called Total Lesion Glycolysis (TLG). The TLG is usually calculated in combination with a lower range. |
MINIMAL |
Minimum of all pixel values. |
MAXIMAL |
Maximum of all pixel values. |
NUMBER_OF_POINTS |
Number of pixels in the VOI. |
HOT_PIXELS_AVERAGED |
After sorting the VOI pixel values in decreasing order, average of the highest Number of Hottest Pixels values. The default number (specified in the configuration) can be changed in the upper part of the dialog. |
Note: The statistics are always calculated using the raw image pixel values, even when the images are shown with smoothing/interpolation enabled. Only full pixels are considered, no partial pixel areas are taken into account. Please enable the Fill ROI box to see which pixels are included in the statistics.
Note the In range box which allows restricting the statistics to the subset of pixels with values in a specific range. For example, by setting the lower threshold to 40% of the maximum it is possible to calculate the average value and the volume of all pixels above 40%. The statistics numbers selected in the Selected Statistic(s) [For Save] area of the VOIs selected in Selected VOI(s) [For Save] can be saved into a new text file using Save, appended to an existing one using Append, copied to the Clipboard or sent directly to PMOD R interface with the Go to R button. The statistic results can be saved as a Dicom structured report with the Save Dicom SR option or exported as a structured report with the Export Dicom SR.
When multiple image files are loaded in appending mode and VOIs are defined for each image, the Statistic calculation is performed for each image available in the list. The statistic results are displayed in separate tabs, as shown in the example below:
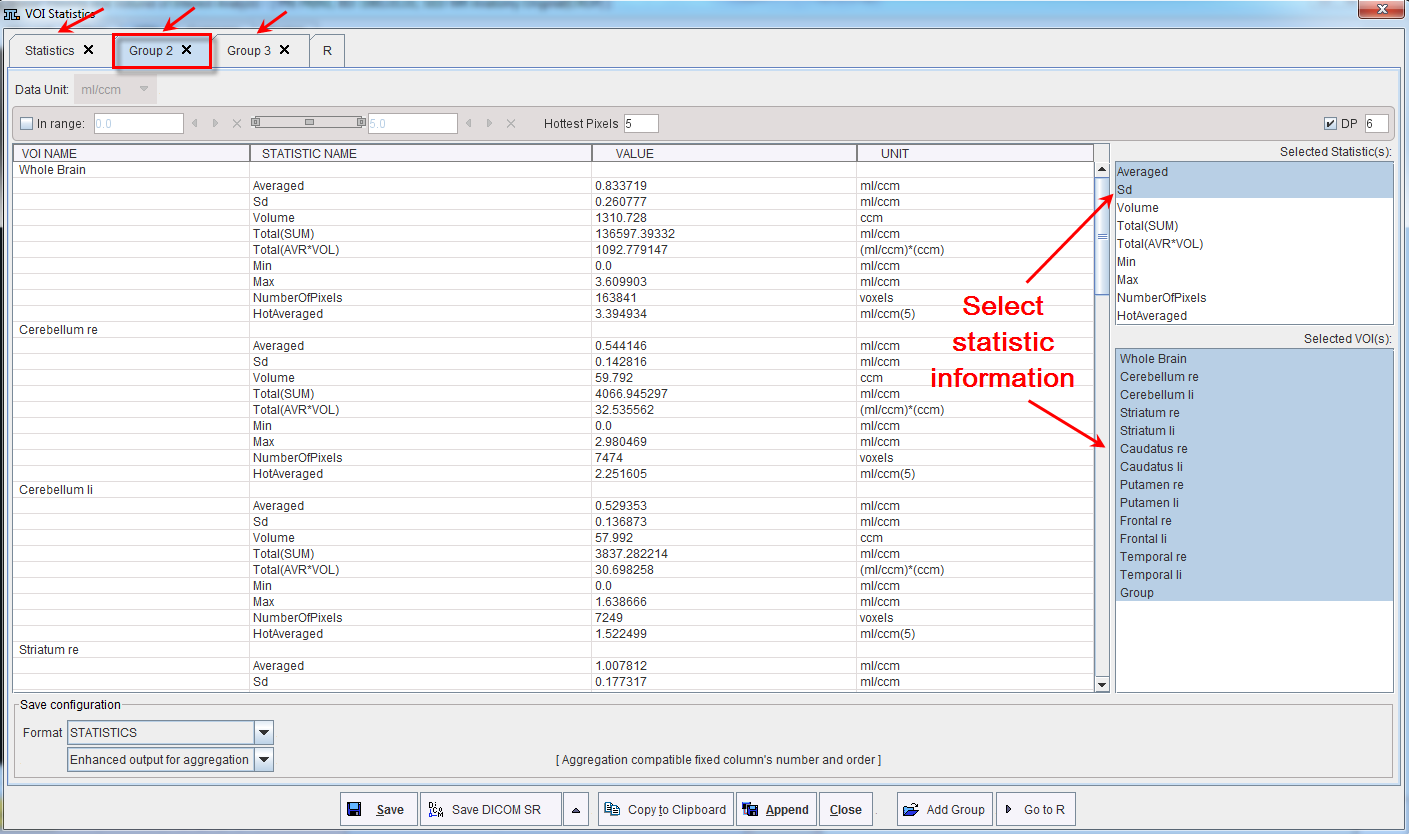
For each tab, statistic information can be selected, and saved or send to R. Note that the Statistic configuration as well as the selection of the statistic information is independent for each tab.
Multi-Statistics and Pixel-Dump
The button Multi Statistics allows applying the same statistics to a set of files in a batch mode operation. After activating Multi Statistics a dialog window appears for selecting the VOIs of interest and the files to be processed.
In case Databased format is configured for loading, the dialog windows looks as follows:
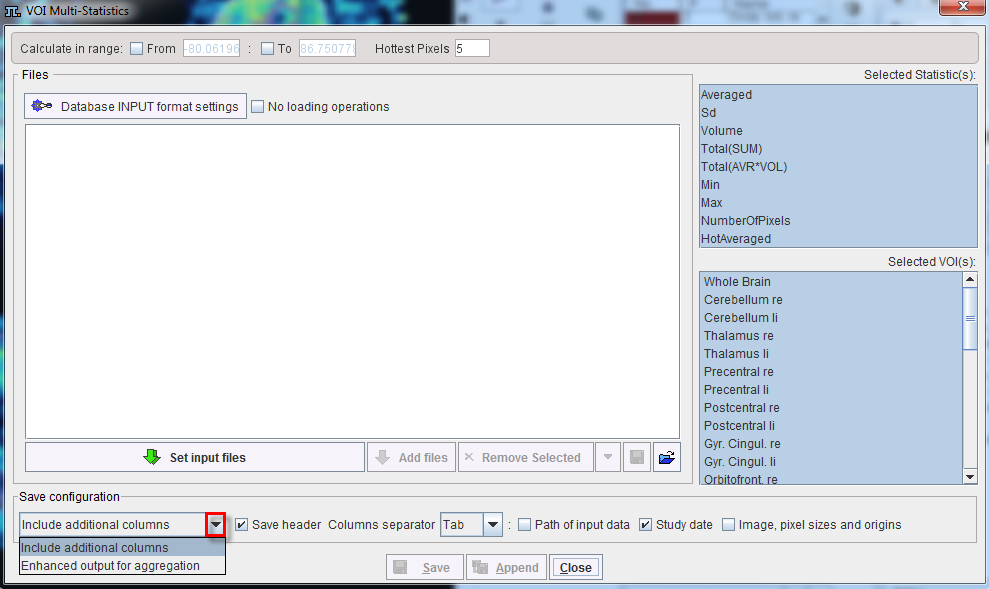
No loading operations |
If the box is checked the image are immediately loaded without any data trasformation. Alternatively, trasformation can be applied during loading using the Database Input format settings. |
Database Input format settings |
Is active when No loading operation box is not checked. Allows defining properties of the image and transformation which are to be applied to the selected images during loading. To apply one or several transformation to the images select one from the list and then perform the configuration in the pop up window. Note that the same transformations are going to be applied to all images in the list.
|
Set Input files |
This button allows selecting the images to be analyzed. |
Add files |
This button allows adding new image files to the list |
Remove selected |
This button allows deleting the selected image from the list. |
Remove all |
This button allows deleting all images in the list |
|
The Save List button allows saving all the images set for loading into a list |
|
The Load List button allows retreiving and loading a previously saved list of images. |
Additional setting is available for selection in the Save configuration section: Enhanced output for the aggregation (recommeded) and Include additional columns.
After activating Save, PMOD will prompt for a result file, and the calculations will be started.
The button Pixel Dump allows dumping the coordinates and values of all pixels in the VOIs to a text file which can later be opened and analyzed in a dedicated statistics program. The files contain columns with the file name, patient name, VOI name, acquisition time, x, y, z, and the pixel value. The same information can be extracted from a batch of files using the Multi - Pixel Dump button.
Visualize Statistics File and R Interface
Statistics files saved as STATISTIC/ Enhanced output for aggregation format can be visualized using the View Statistics option in the Statistic selection list.
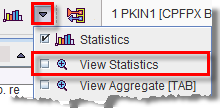
The same selection is available in the Pview lateral taskbar.
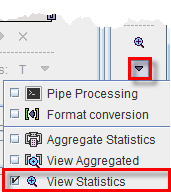
Once the statistic file is retrieved a dialog window opens and allows sending the data to R . Activating the Go to R button, the program automatically switches to the R interface while loading the available statistics data.