![]()
![]()
![]()
![]()
|
|
|
|
|
The one-way ANOVA compares the means between the groups and determines whether any of those means are significantly different from each other.
The NULL hypothesis (H0) assumes that all group population means are equal. The alternative hypothesis (Ha) is that there are at least two group means that are significantly different from each other. If the result is statistically significant, the alternative hypothesis is accepted.
The one-way ANOVA is a statistic test can only detect that least two groups are different, but not which ones. To this end a post-hoc comparison test needs to be applied. The ANOVA script applies the Tukey's HSD (Honest Significant Difference) test.
Assumptions
The results of a one-way ANOVA can be considered reliable as long as the following assumptions are met:
ANOVA Configuration
The configuration window is illustrated below.
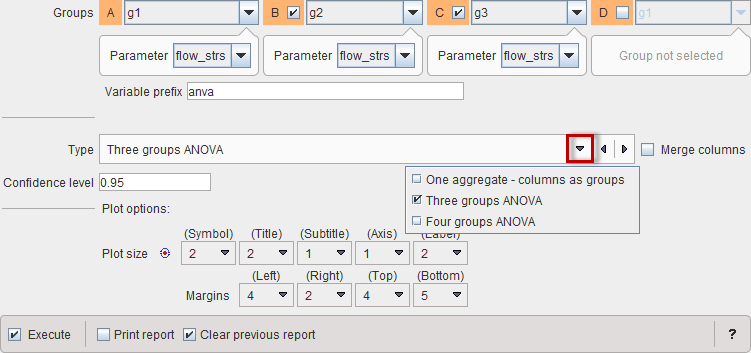
Basically, there are two usage types:
ANOVA Results
The script produces result tables related to the ANOVA (anva_result) and Tukey (anva_tukey) as well as plots for the results visualization.
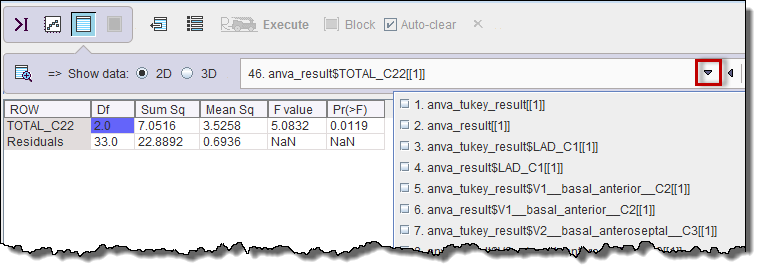
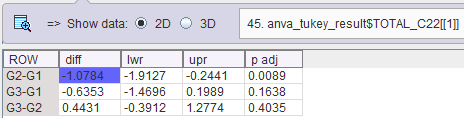
Note the p-value which is below 0.95, indicating that there is a significant difference which can be localized for G2-G1 in the Tukey table below. For r G2-G1 p<0.05 where it is >0.05 for the other comparisons.
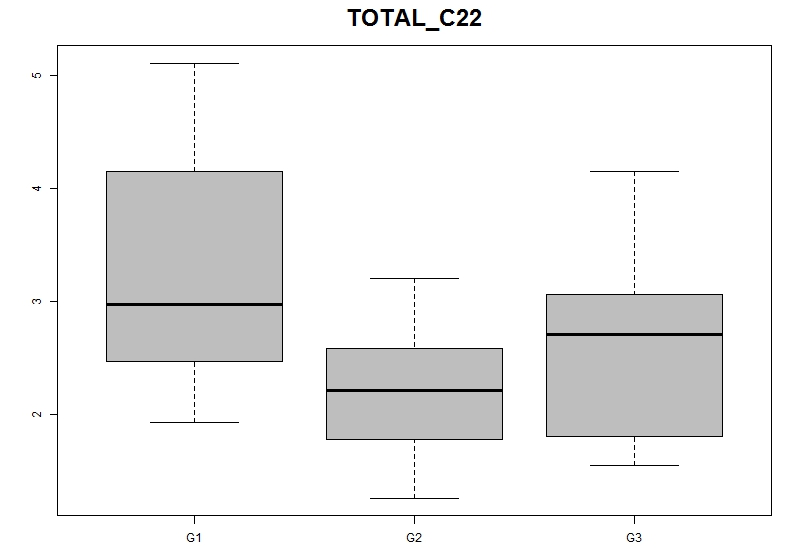
The plot layout contains a box plot per VOI, showing the characteristics of the groups next to each other. In the example below the difference between G1 and G2 is supported.
The second plot which is available per VOI visualizes the 95% confidence interval of the group differences.
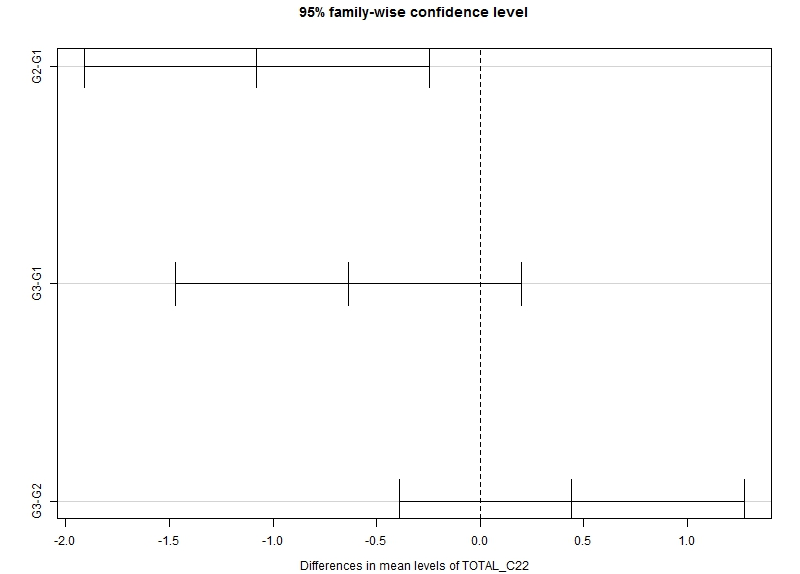
If zero is not included in the confidence interval, the difference is significant.