![]()
![]()
![]()
![]()
|
|
|
|
|
An instructive summary of the background and the application of the t-test can be found on Wikipedia [1]. Briefly, it is a family of statistical hypothesis tests which can be used to determine if two sets of data are significantly different from each other.
Depending on the application case (null hypothesis, data) different test statistics formula need to be applied to the data. They all result in a t-value, which can be converted into a p-value using a table of values from Student's t-distribution.
The p-value is the probability of the obtaining at least the observed t-value, assuming that the null hypothesis is true. Therefore, if the calculated p-value is below the threshold chosen for statistical significance (usually the 0.10, the 0.05, or 0.01 level) and therefore highly unlikely, the null hypothesis is rejected in favor of the alternative hypothesis.
t-Test Configuration
The t-Test script in the R console implements a t-test between two samples. Its configuration window has the following form.
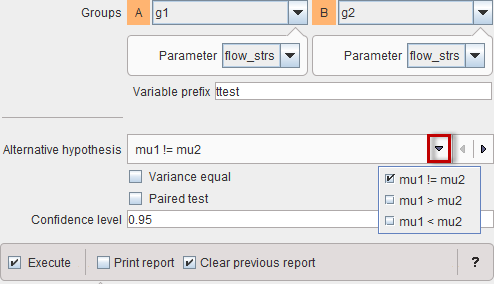
Note the Alternative hypothesis selection which allows configuring a two-sided test (mu1!=mu2) or one-sided tests (mu1>mu2, mu1<mu2). If the variance in the two samples is equal, the Variance equal box should be checked for using the pooled variance rather than an approximation. The Paired test should only be enabled in if this condition is met by the two samples. In this case, the data will be sorted for appropriate sample pairing.
t-Test Results
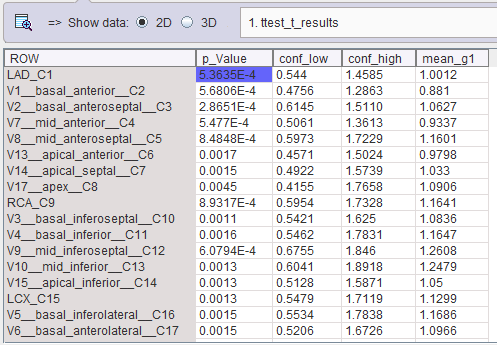
The script only returns numeric results in the form of the ttest_t_results table. The example below illustrates the outcome with an unpaired two-sided test.
For each region the p_value, the lower and upper confidence intervals (conf_low, conf_high) as well as the means of the two groups (mean_g1, mean_g2) are listed. In the example above, all regional means are significantly different, since the p-values are below 5%.
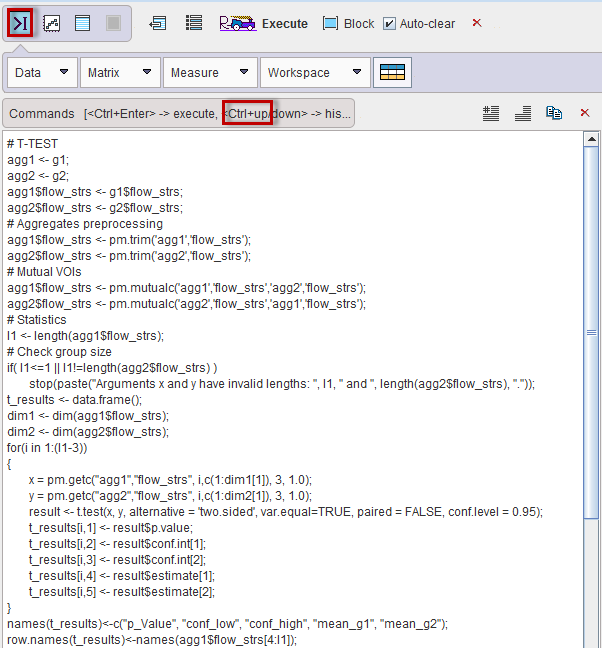
As an example, the R code for this analysis can easily be inspected in the command layout, entering Ctrl+Up-arrow with the keyboard.
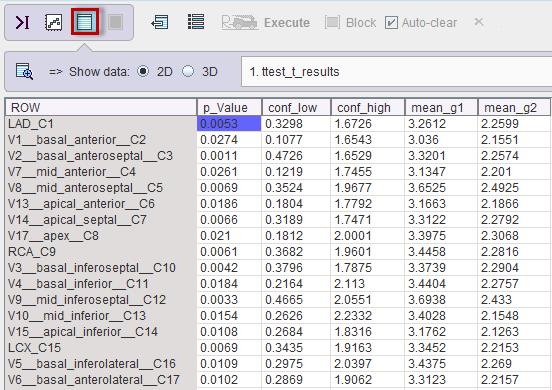
Analyzing the same data with at paired t-test (which is actually justified), the significance of a different mean is even higher. Note that the conf_low and conf_high as well as mean_g1 are now related to the difference values.