![]()
![]()
![]()
![]()
|
|
|
|
|
Data Loading
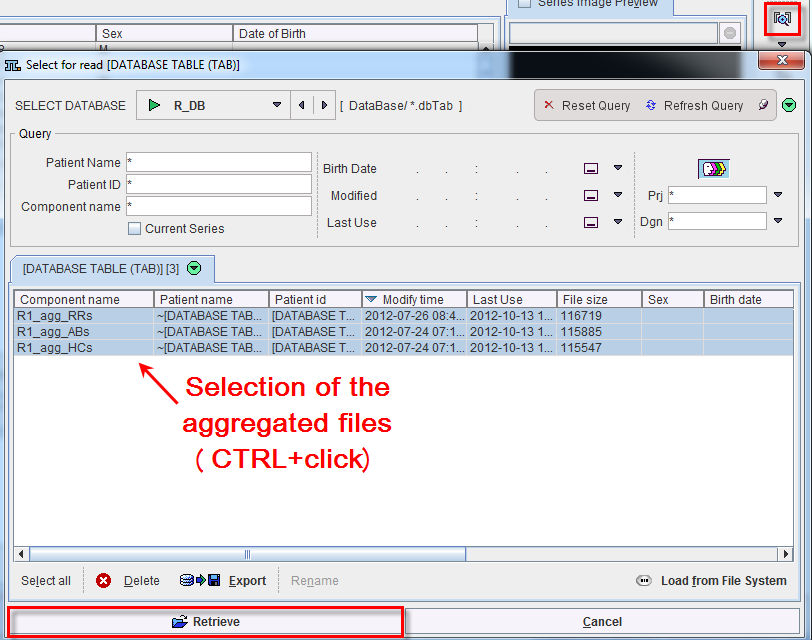
Activate the View aggregated functionality available on the lateral taskbar to load the aggregated files prepared in the previous section. A dialog window opens. The files may be available in a database as in the example below, or alternatively the Load from File System button can be used to define the directory where the files reside. When all the appropriate files are selected activate the Retrieve button.
Upon retrieval, a dialog window opens and allows inspecting the aggregation results. The statistic individual files are available for inspection in the Statistic set selection list. Each aggregated file is loaded in a separate tab.
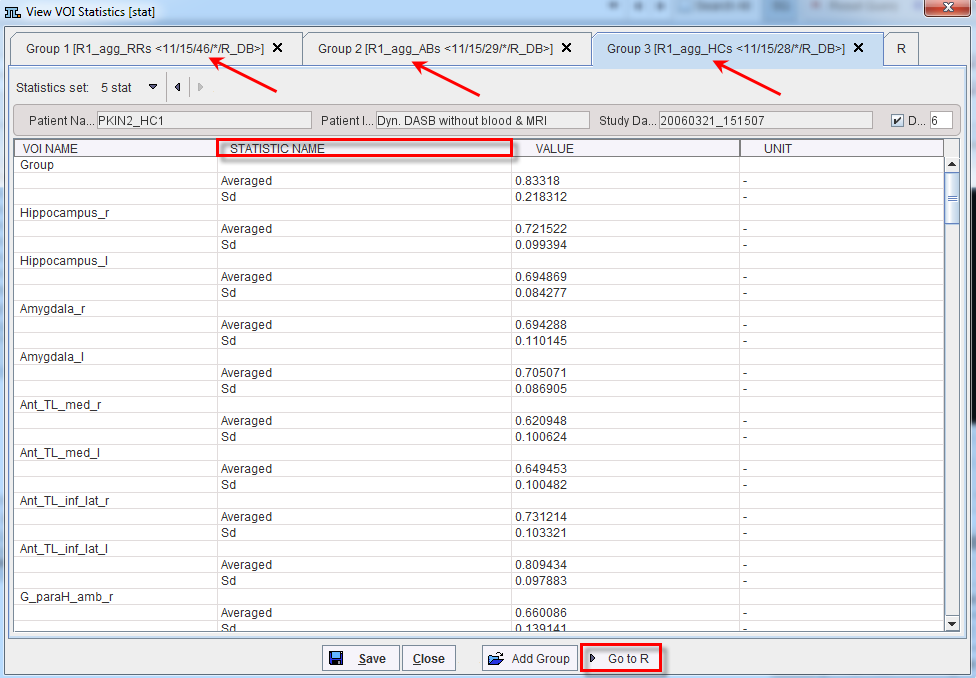
Activate the Go to R button to start the transfer of the data to the PMOD R statistic interface. A dialog window opens showing the PMOD R Command window  .
.
All the information available in the aggregated files is transferred to the R console. For each STATISTIC NAME the program automatically associates a variable in the workspace. After the transfer, the number of the variables in the workspace is the same as the number of entries in the STATISTIC NAME column of one VOI name. The variable name is assigned automatically and is encoded as follows:
Data Inspection
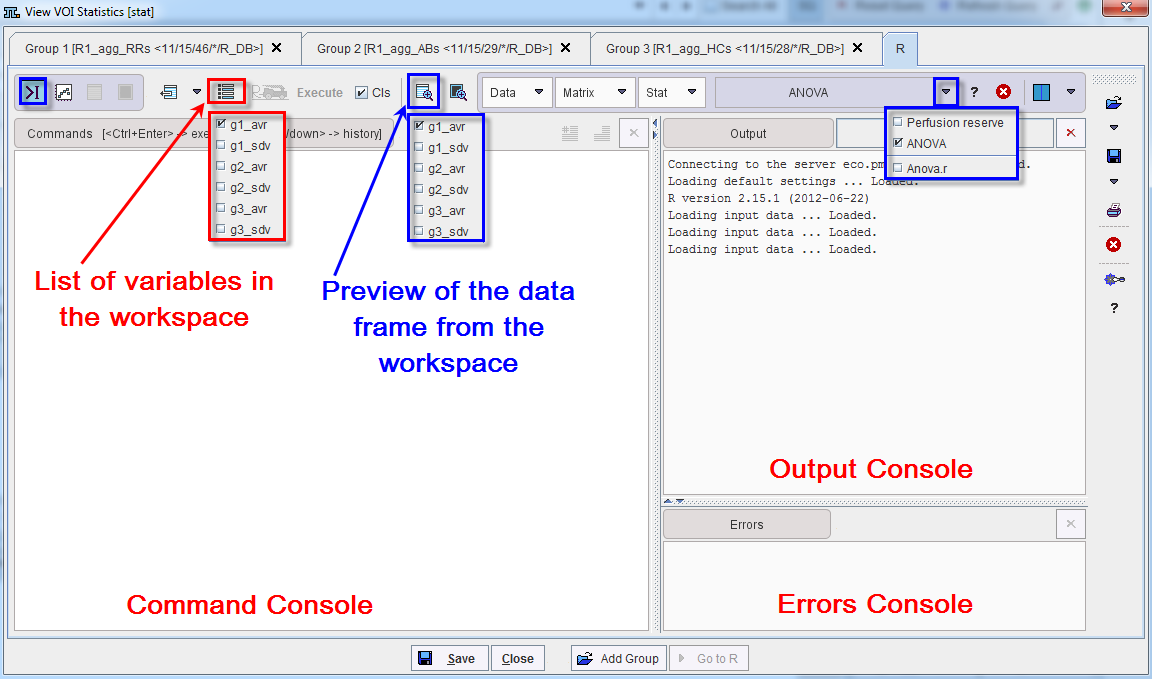
The variables available in the workspace can be visualized activating the List icon ![]() in the General toolbar.
in the General toolbar.
To preview a data frame from the workspace activate the Preview icon ![]() in the General toolbar and select one of the variables (e.g. g1_avr). The program automatically switches to the PMOD R Table window
in the General toolbar and select one of the variables (e.g. g1_avr). The program automatically switches to the PMOD R Table window  :
:
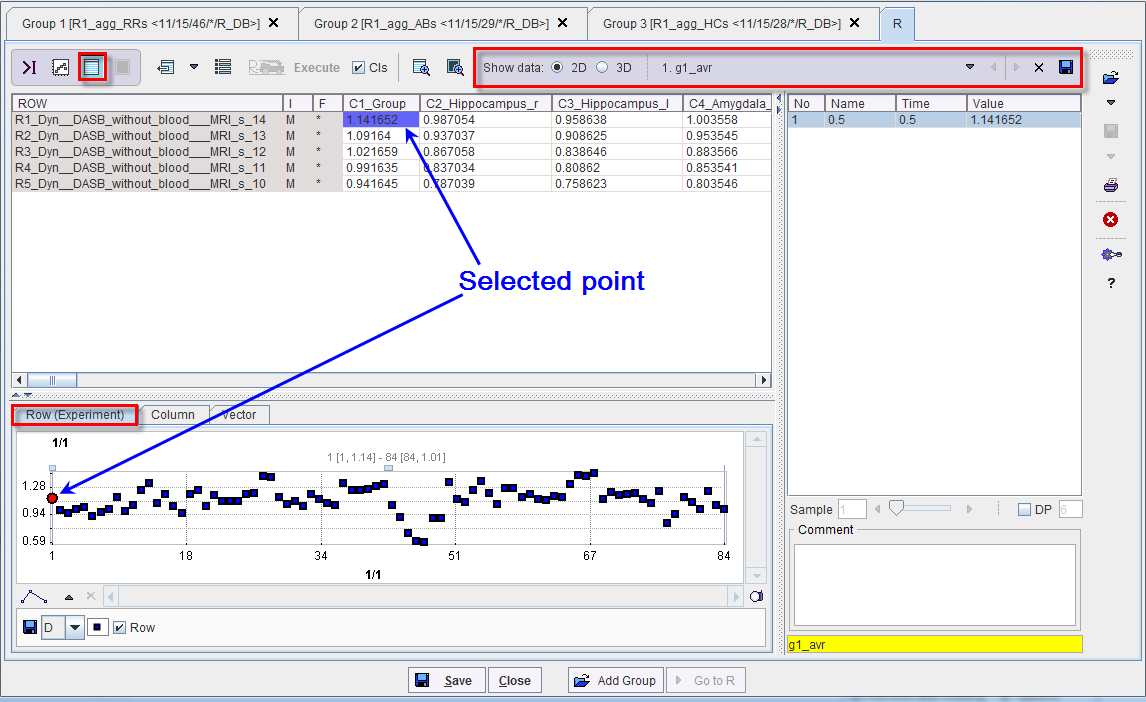
The Show data is set by default to the 2D visualization. Thus, the variable is diplayed as a table in the upper left pane and as a plot in the lower left pane. The right pane is displaying the selected value into the table. The data on the ROW represents the VOIs average statistics available for one subject. The data are visualized as plot on the Row (Experiment) tab. The column data represents the average statistic information of one VOI for each subject from the group. The graphic visualization of the column data is available for inspection in the Column tab. The content of the right pane is plotted in the Vector tab.
The selected point can be changed by double clicking in the table pane. The plot tabs are updated accordingly. The value selected in the table is highlighted in blue. The corresponding value in the plots is shown as a red dot.
Anova Analysis
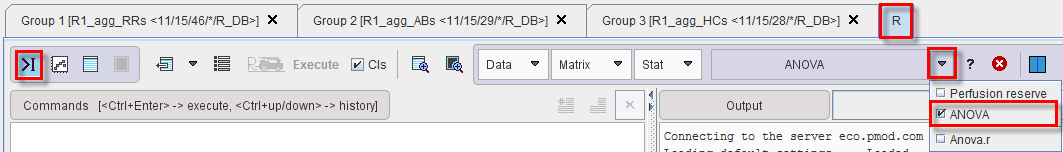
To start the anova analysis within PMOD R interface switch back to the Command window activating the dedicated icon in the tool bar. Make sure you select the ANOVA option from the predefined scripts selection list. Activate the ANOVA button with a simple left mouse click.
The ANOVA setting window appears and allows selecting the variables to which the 3 groups ANOVA will be applied.
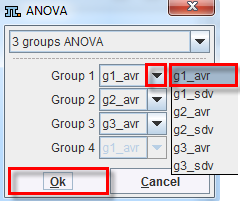
To confirm the setting activate the OK button. The program starts the calculations and generates the results.