![]()
![]()
![]()
![]()
|
|
|
|
|
The results obtained after running the PMOD R ANOVA implementation are:
Descriptive Statistic Table
The descriptives table provides statistics information, including the mean, standard deviation and 95% confidence intervals for the dependent variable for each separate group (HC, AB & RR) as well as when all groups are combined. These values can be used to describe the data.
ANOVA Table
This table shows the output of the ANOVA analysis and whether there is a statistically significant difference between the group means. In the Table  window select as Show data 2D the result[[1]] table:
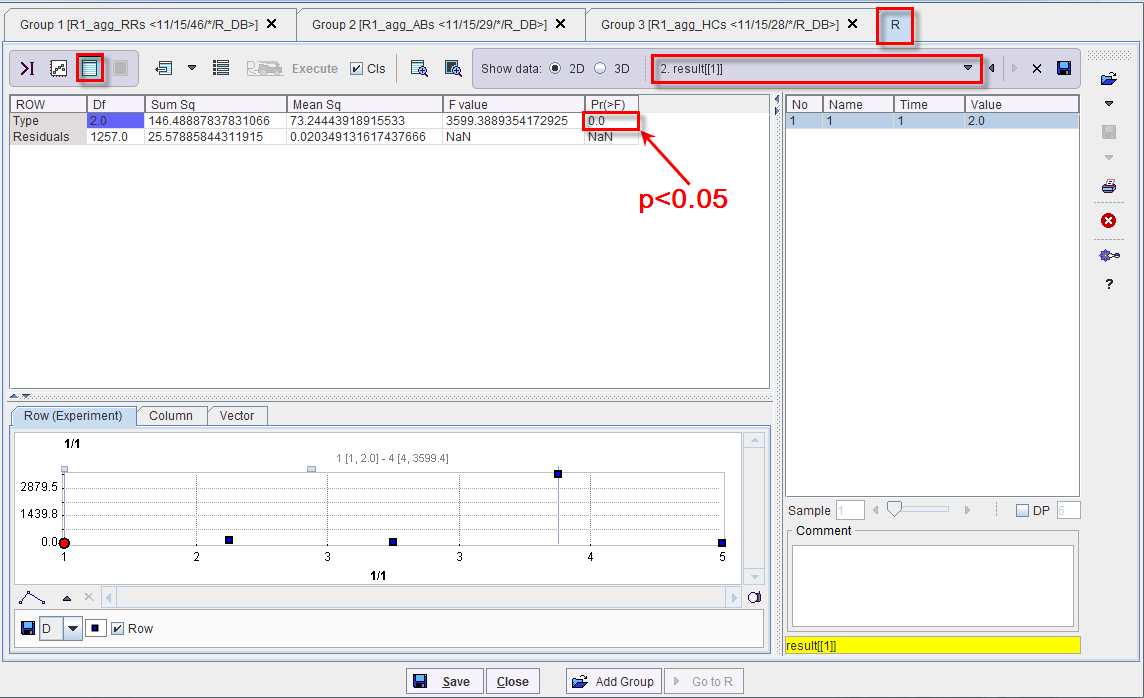
In this example the significance level is 0 (p = 0.0), which is below 0.05. Therefore, there is a statistically significant difference in the mean average of the BP. Therefore, the alternative hypothesis is accepted. However, we do not know which of the specific groups differed. This information is available in the multi comparison table which contains the results of Tukey post-hoc tests.
Tukey's Multi Comparison Table
From the previous results we know that there are significant differences between the groups as a whole. In the Table window select as Show data the mcTukeyresults&Type:
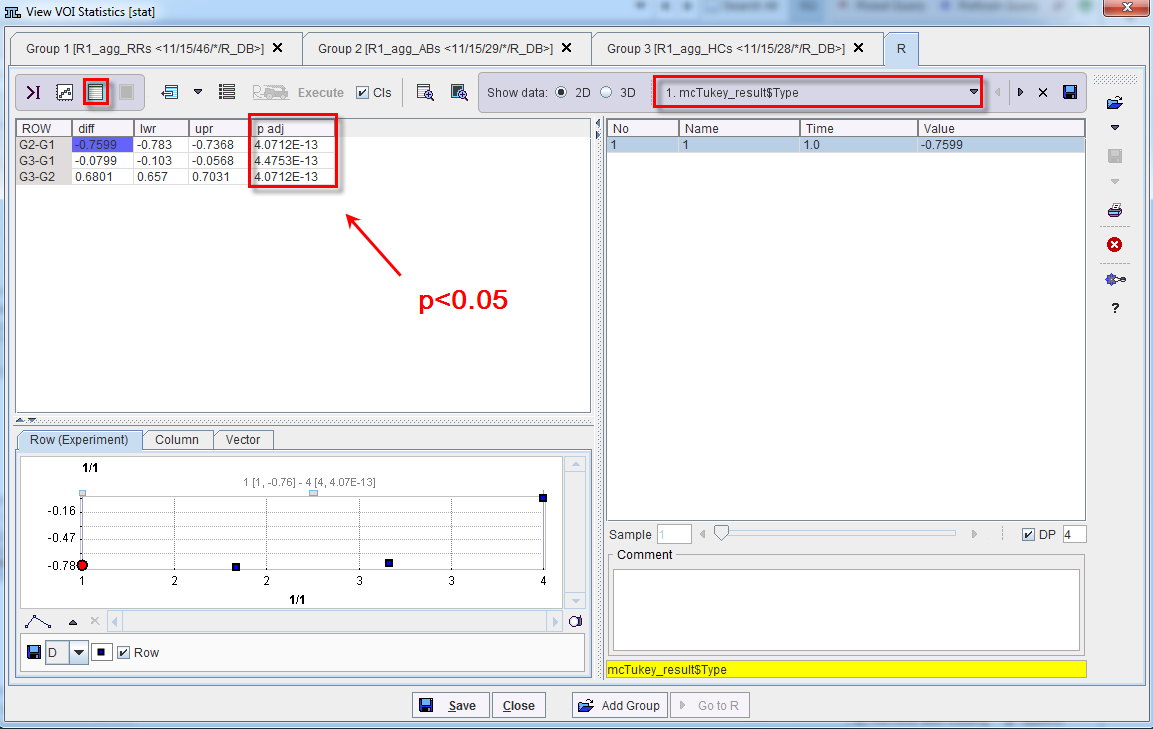
The table shows which groups differed from each other. The procedure returns the difference between means for each pair of groups, the lower and upper limits of a 95% confidence interval for that difference, and the p-value for the Tukey test. Of course, the validity of all of this depends upon how well the assumptions of the ANOVA test are fulfil in the first place.
We can see from the table that there is a significant difference between group RR and AB (p = 4.07e-13) between group RR and HC (p = 4.47e-13) and bewteen group AB and HC (p = 4.07e-13).
Boxplot
The boxplot are representing an easy way to present the data. In the Plot ![]() window, Characteristic toolbar, select the second option in the list:
window, Characteristic toolbar, select the second option in the list:
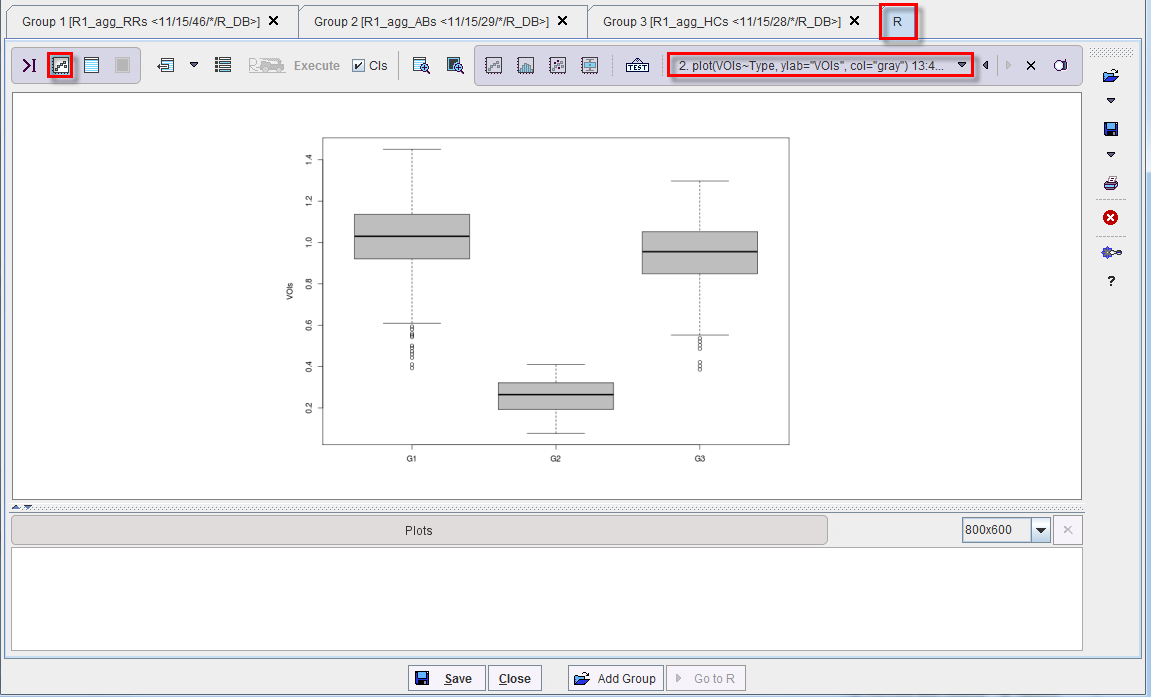
The distributions look normal, however, there are outliers and homogeneity assumption is not achieved. The differences bewteen groups appear to be important.
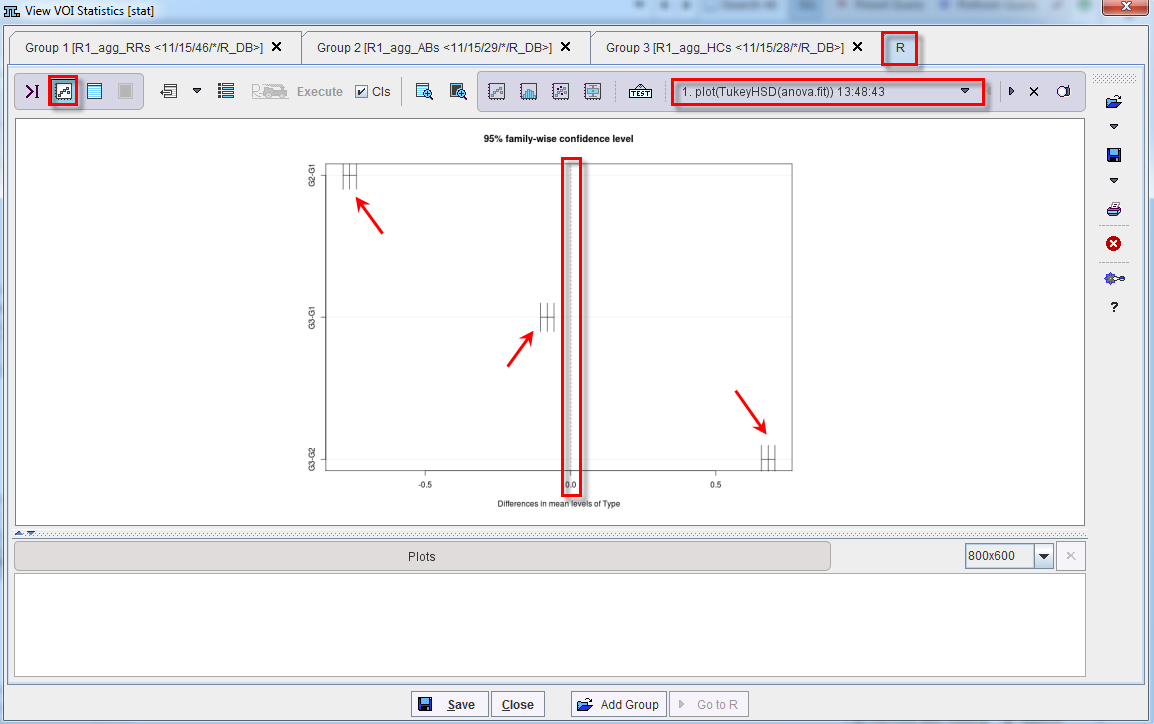
Tukey's Multi Comparison Plot
The multi comparison table revealed that between groups the BP means difference is significant at 5% level if the confidence interval around the estimation of the difference does not contain zero.
This can be visualized by plotting the post-hoc comparison results. This plot is automatically generated with the ANOVA implementation in the PMOD R Plot interface:
NOTE:
The ANOVA analysis within PMOD R interface was explained for demostration purposes. The data were simulated starting from one real data set, thus the BP values might not reflect the reality.